GIS Projects

Maps that listen to the land

“Mapping is not just about data — it’s about understanding what the Earth is saying. My GIS work is where science meets soul.”

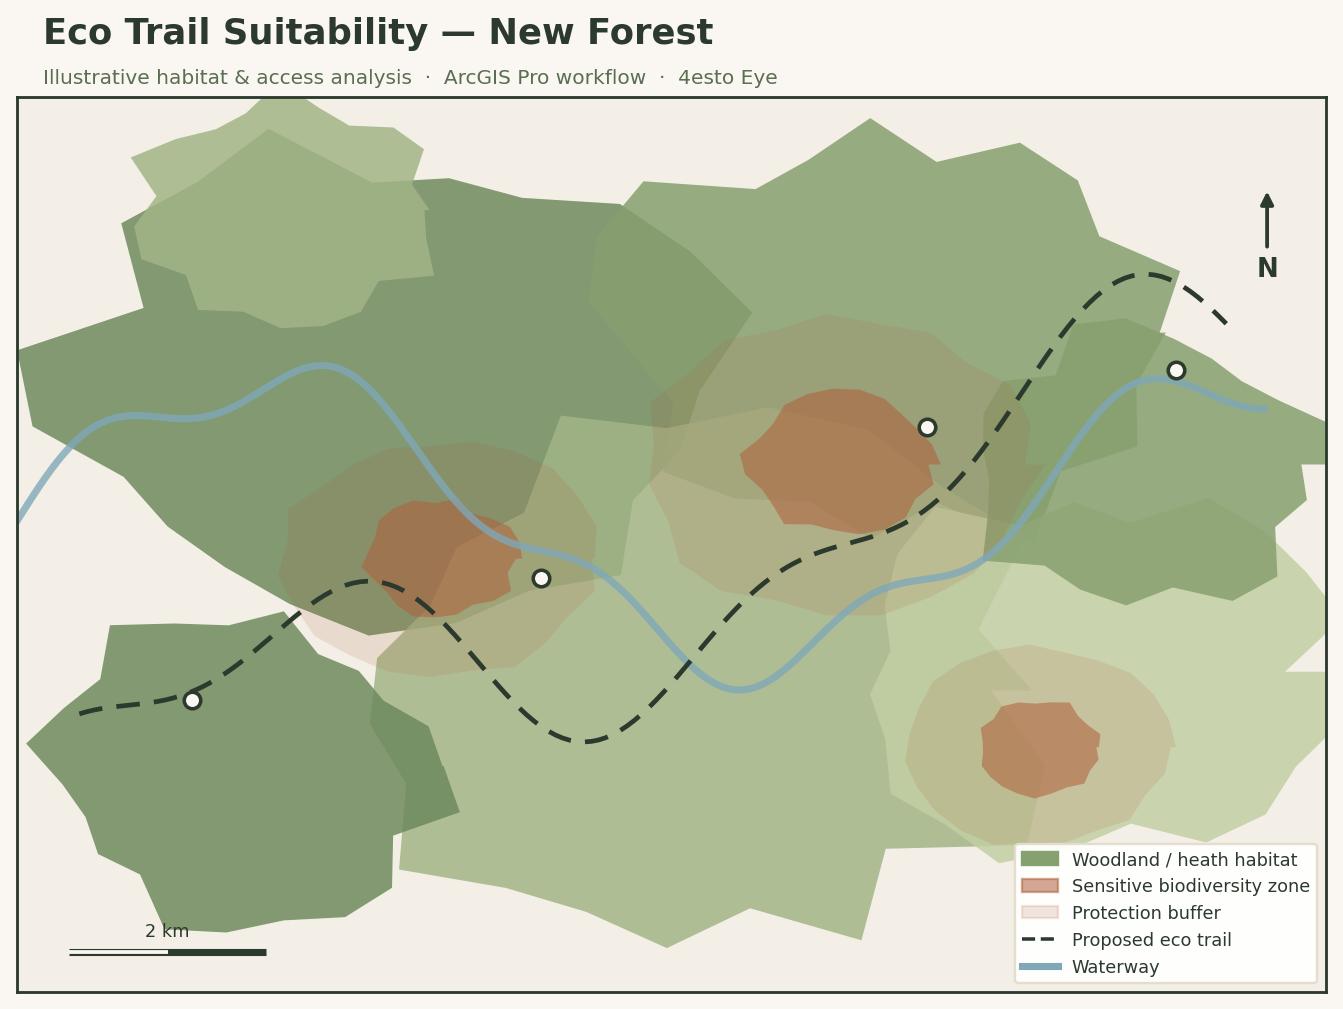
Eco trail and biodiversity map of the New Forest

United Kingdom · Design & Conservation

Eco Trail Design & Biodiversity Mapping — New Forest

This project focuses on designing an eco-sensitive trail system within the New Forest using GIS-based ecological analysis. The aim is to understand how people can access and learn from natural landscapes without disturbing biodiversity-rich and sensitive areas.

I mapped habitats, biodiversity zones, existing trails, and buffer areas to assess environmental suitability for low-impact movement and learning. The project highlights how GIS can support conservation-led planning while still enabling meaningful nature engagement.

Tools & methods: ArcGIS Pro, ecological suitability mapping, habitat and biodiversity datasets, buffer analysis, trail network analysis, GIS visualisation.
Heat exposure map of the UK

United Kingdom · Climate

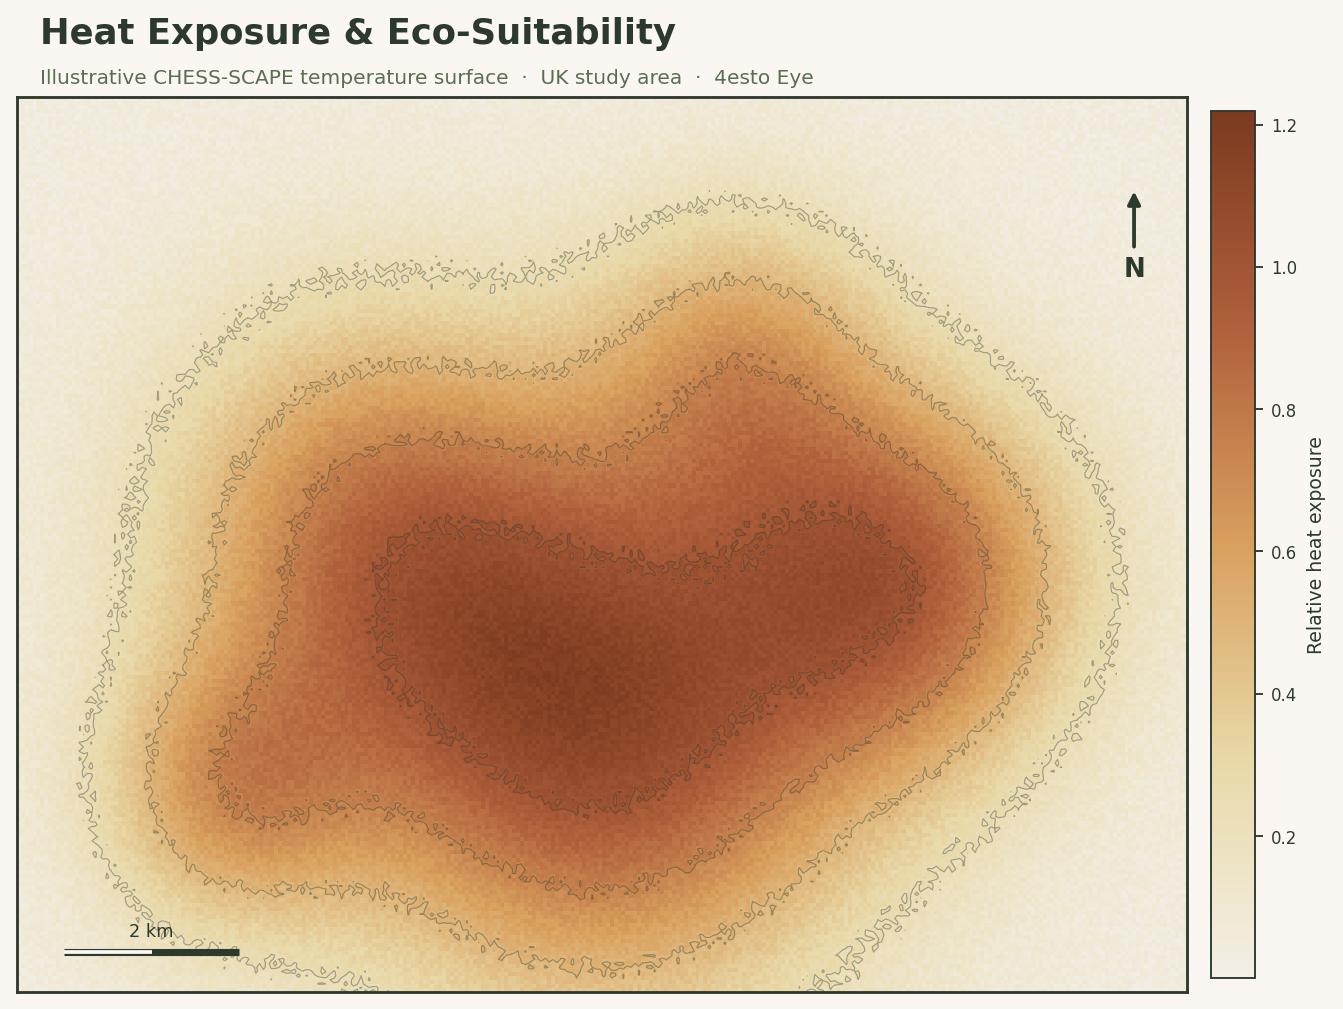
Heat Exposure & Environmental Suitability

Analyses temperature exposure patterns using high-resolution climate data (CHESS-SCAPE) to understand environmental stress. Produces eco-suitability maps that identify areas more or less suitable for outdoor activity under increasing heat conditions.

Tools & methods: CHESS-SCAPE climate data, heat mapping, spatial statistics, eco-suitability analysis, GIS modelling.

Street-level map of Mannady, Chennai

Chennai, India · Community

Street-Level Mapping — Mannady

Created a detailed street-level map of the Mannady area with ActionAid. Digitised roads, lanes, and local features to support community planning. This work strengthened my interest in people-centred GIS, where maps directly support local needs.

Tools & methods: QGIS, detailed vector mapping, spatial data cleaning, map production.

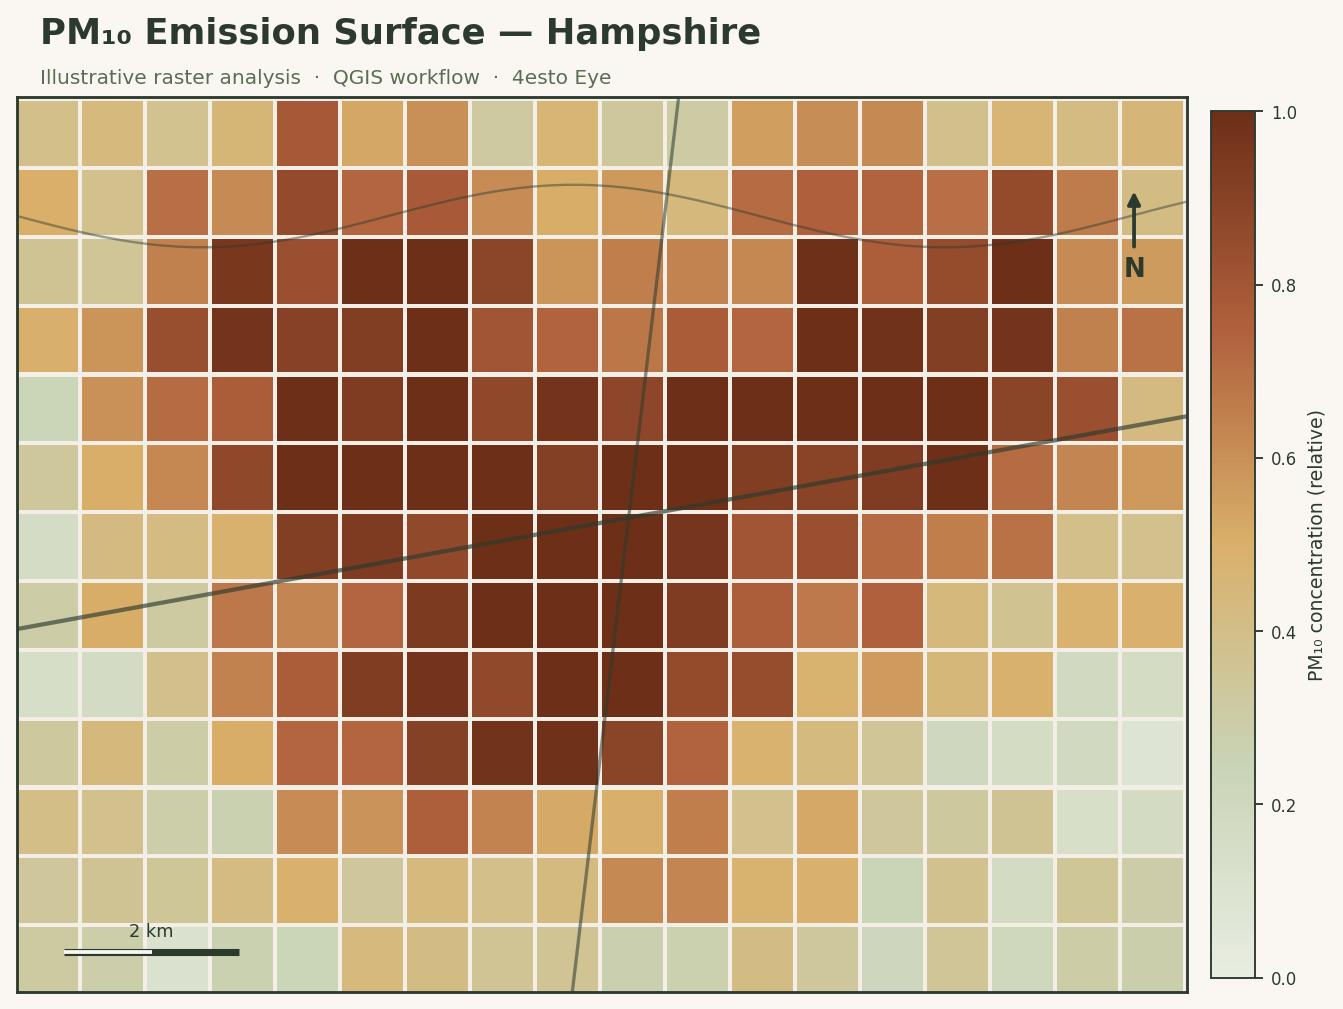
PM10 air quality map of Hampshire

Hampshire · Health

Emission & Air Quality Mapping

Analysed PM10 air pollution levels to understand spatial patterns of emissions. Visualised pollution distribution and explored relationships between land use and environmental quality — making invisible environmental problems visible.

Tools & methods: QGIS, raster analysis, environmental datasets, spatial visualisation.

“Maps can tell stories, and nature can teach — if we take the time to observe.”

Interested in working together? Get in touch →